6. Design of Experiment Generator

Design of Experiment (DOE) is an important activity for any scientist, engineer, or statistician planning to conduct experimental analysis. This exercise has become critical in this age of rapidly expanding field of data science and associated statistical modeling and machine learning. A well-planned DOE can give a researcher meaningful data set to act upon with optimal number of experiments preserving critical resources.
After all, aim of Data Science is essentially to conduct highest quality scientific investigation and modeling with real world data. And to do good science with data, one needs to collect it through carefully thought-out experiment to cover all corner cases and reduce any possible bias.
6.1. Quick start
Let’s say you have a design problem with the following table for the
parameters range. Imagine this as a generic example of a chemical
process in a manufacturing plant. You have 3 levels of Pressure, 3
levels of Temperature, 2 levels of FlowRate, and 2 levels of
Time.
Pressure |
Temperature |
FlowRate |
Time |
|---|---|---|---|
40 |
290 |
0.2 |
5 |
50 |
320 |
0.3 |
8 |
70 |
350 |
First, import build module from the package,
from doepy import build
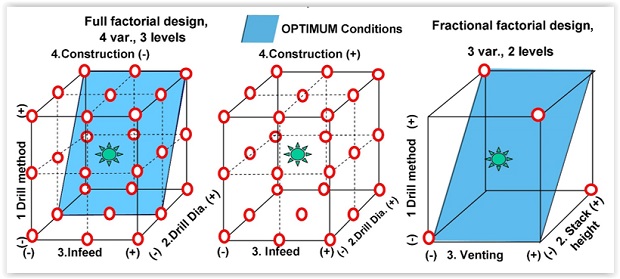
Then, try a simple example by building a full factorial design. We
will use FULL FACTORIAL function for this. You have to pass a
dictionary object to the function which encodes your experimental data.
FULL FACTORIAL(
{'Pressure':[40,55,70],
'Temperature':[290, 320, 350],
'Flow rate':[0.2,0.4],
'Time':[5,8]}
)
If you build a full-factorial DOE out of this, you should get a table with 3x3x2x2 = 36 entries.
Pressure |
Temperature |
FlowRate |
Time |
|---|---|---|---|
40 |
290 |
0.2 |
5 |
50 |
290 |
0.2 |
5 |
70 |
290 |
0.2 |
5 |
40 |
320 |
0.2 |
5 |
… |
… |
… |
… |
… |
… |
… |
… |
40 |
290 |
0.3 |
8 |
50 |
290 |
0.3 |
8 |
70 |
290 |
0.3 |
8 |
40 |
320 |
0.3 |
8 |
… |
… |
… |
… |
… |
… |
… |
… |
There are, of course, half-factorial designs to try!
6.2. Latin Hypercube design
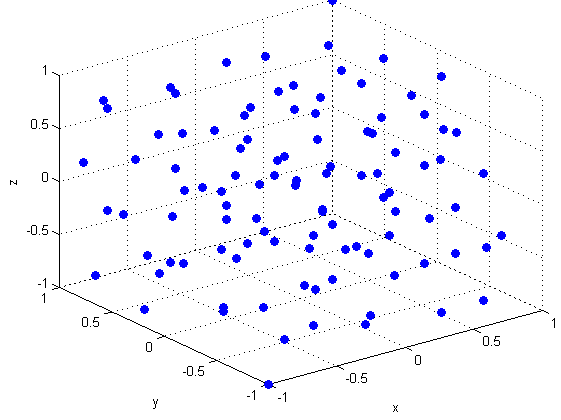
Sometimes, a set of randomized design points within a given range could be attractive for the experimenter to asses the impact of the process variables on the output. Monte Carlo simulations are close example of this approach.
However, a Latin Hypercube design is better choice for experimental design rather than building a complete random matrix as it tries to subdivide the sample space in smaller cells and choose only one element out of each subcell. This way, a more uniform spreading’ of the random sample points can be obtained.
User can choose the density of sample points. For example, if we choose to generate a Latin Hypercube of 12 experiments from the same input files, that could look like,
SPACE FILLING DOE DESIGN(
      {'Pressure':[40,55,70],
      'Temperature':[290, 320, 350],
      'Flow rate':[0.2,0.4],
      'Time':[5,11]},
      num_samples = 12
      )
Pressure |
Temperature |
FlowRate |
Time |
|---|---|---|---|
63.16 |
313.32 |
0.37 |
10.52 |
61.16 |
343.88 |
0.23 |
5.04 |
57.83 |
327.46 |
0.35 |
9.47 |
68.61 |
309.81 |
0.35 |
8.39 |
66.01 |
301.29 |
0.22 |
6.34 |
45.76 |
347.97 |
0.27 |
6.94 |
40.48 |
320.72 |
0.29 |
9.68 |
51.46 |
293.35 |
0.20 |
7.11 |
43.63 |
334.92 |
0.30 |
7.66 |
47.87 |
339.68 |
0.26 |
8.59 |
55.28 |
317.68 |
0.39 |
5.61 |
53.99 |
297.07 |
0.32 |
10.43 |
Of course, there is no guarantee that you will get the same matrix if you run this function because this are randomly sampled, but you get the idea!
6.3. Designs available
Try any one of the following designs:
Sukharev grid, Optimal strategies of the search for an extremum, A. G. Sukharev (1971).
Box-Wilson (Central-composite) with center-inscribed option ,
Box-Wilson (Central-composite) with center-circumscribed option ,
6.4. Simplified user interface
There are other DOE generators out there. But they generate
n-dimensional arrays. doepy is built on the simple theme of being
intuitive and easy to work with - for researchers, engineers, and social
scientists of all background - not just the ones who can code.
User just needs to provide a simple CSV file with a single table of variables and their ranges (2-level i.e. min/max or 3-level).
Some of the functions work with 2-level min/max range while some others need 3-level ranges from the user (low-mid-high). Intelligence is built into the code to handle the case if the range input is not appropriate and to generate levels by simple linear interpolation from the given input.
The code will generate the DOE as per user’s choice and write the matrix in a CSV file on to the disk.
In this way, the only API user needs to be exposed to, are input and output CSV files. These files then can be used in any engineering simulator, software, process-control module, or fed into process equipment.
This document is derived from another project acknowledged at end of the documentation.