3. DOE
In the DOE view, you will be able to select data that you want to test.
Click on “DOE” in the sidebar
Figure 2.0
..and click Create DOE
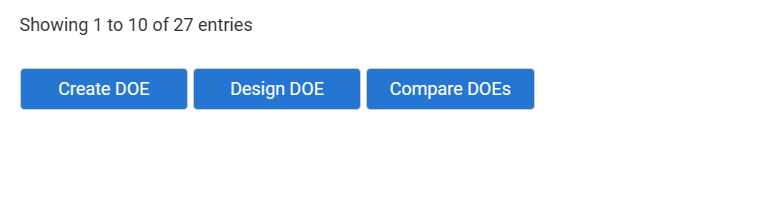
Figure 2.1.1
Once you do that, this page will come up. We have several options that will create the design of your experiment. The substrate, Lot ID, Vehicle (Flow), Projectname, Priority, Project account number, primary and secondary secondary ownership, Number of response variables, the total splits, editable and EoL, and the motivation behind the DOE.
A pre-populated list of response variables can be added to the Confab site as follows,
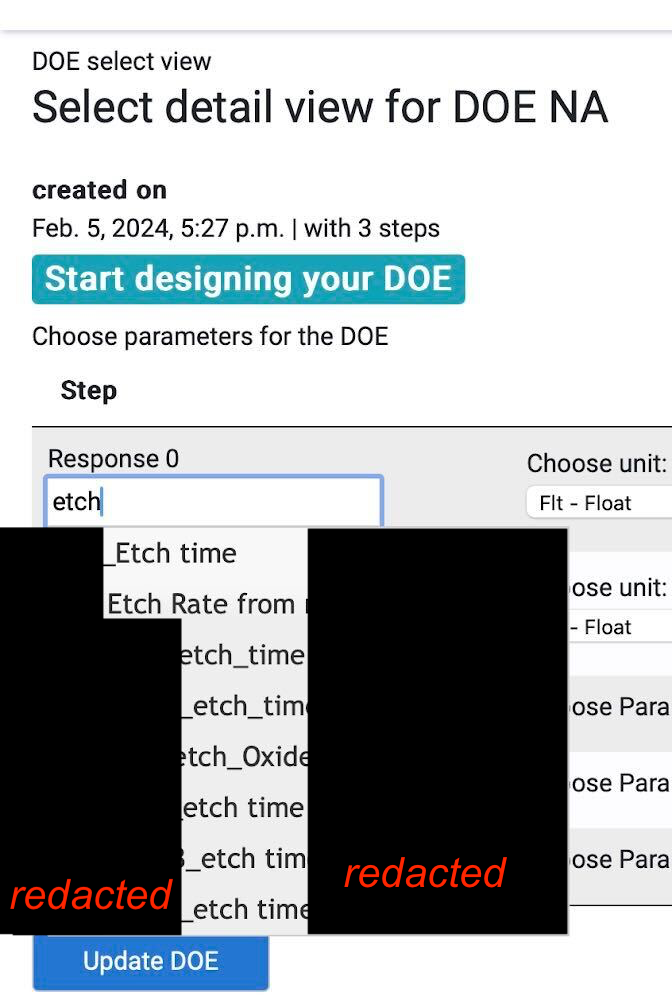
Figure 2.1.2
The Lot ID will have a default id that can be changed. The Vehicle is going to be the recipe that we have worked on, and the project name will be the variant of that recipe. This would be chocolate cake in our example, a variant of cake. The Primary and secondary owner is there to show contributors to the DOE, the total splits shows the maximum number of runs the experiment went through, and the motivation for the DOE describes the purpose of the experiment for others that are reading it.
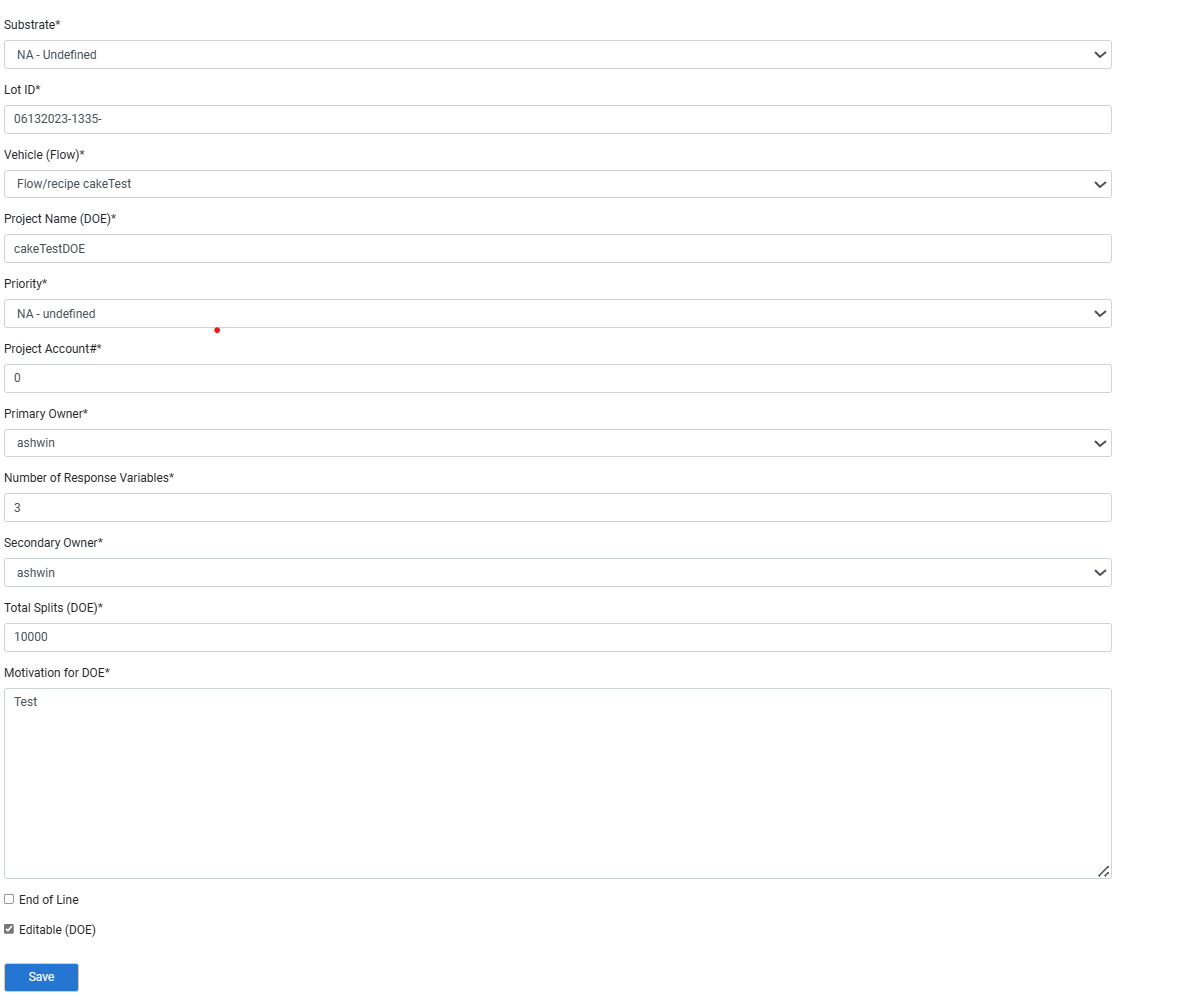
Figure 2.2
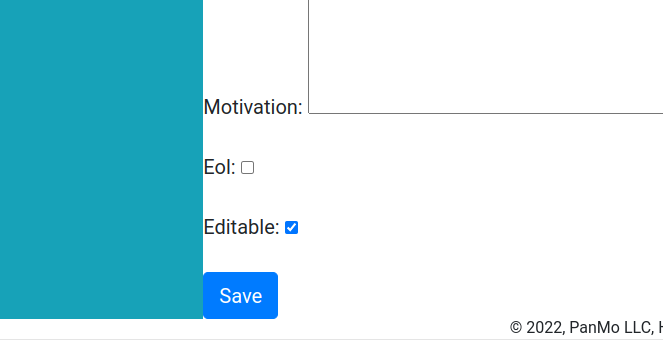
Figure 2.2
Substrate is something your experiment will rely on. When baking a cake the substrate might be a 9 inch pan. If none of the options seem right or do not apply, undefined will be your choice.
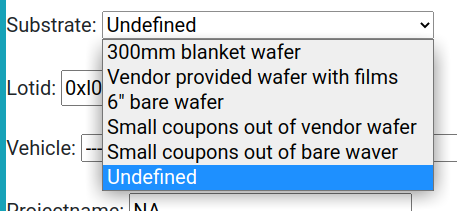
Figure 2.3
Priority is here to show how important it is to the experiment.
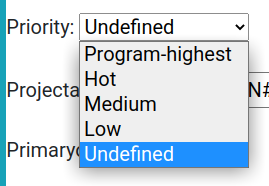
Figure 2.4
Once you click save it will take you to a page with all the parameters in your Flow. You can individually select the ones you want to use for your experiment.
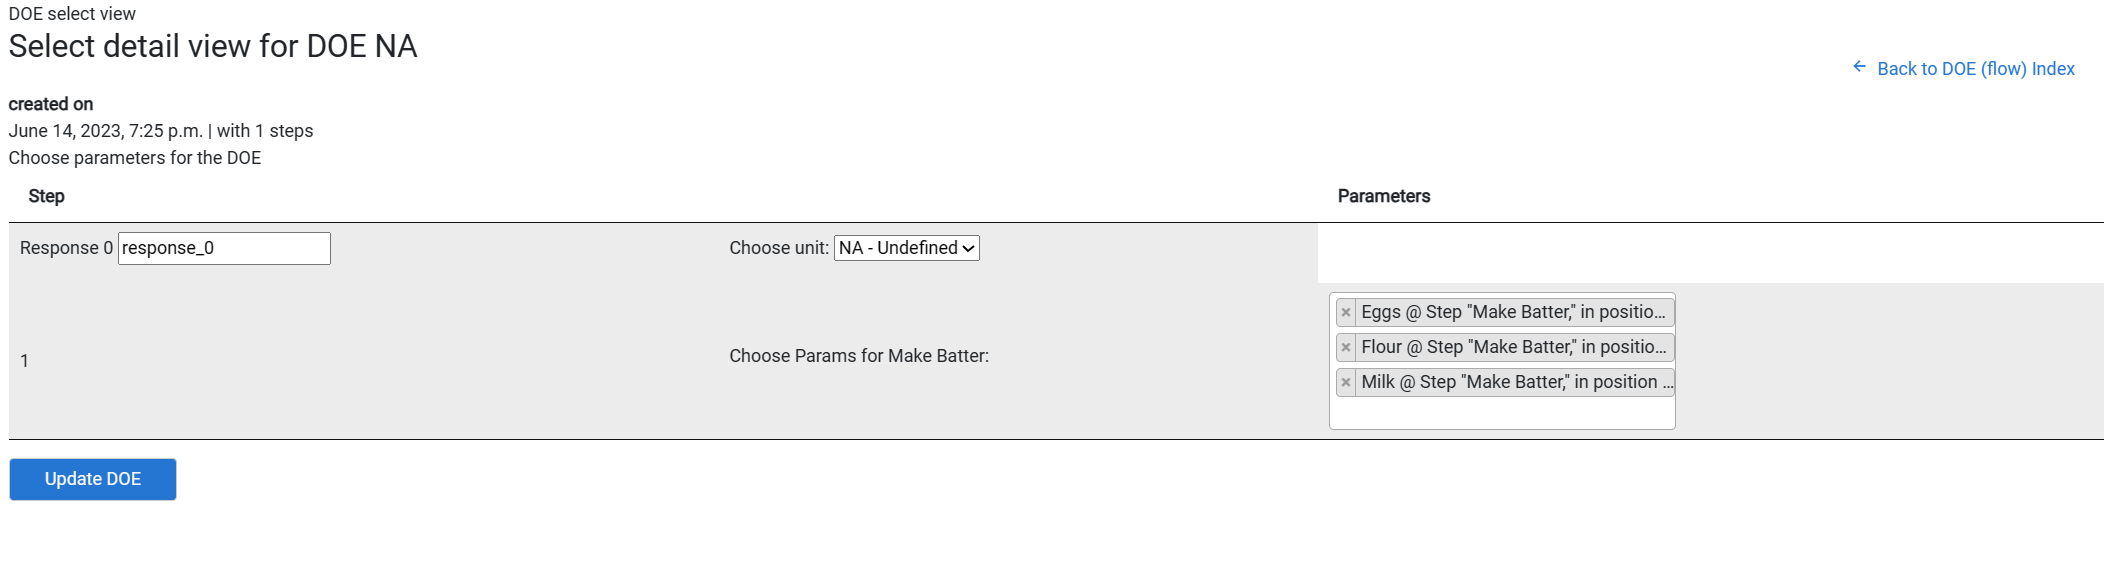
Figure 2.5
This will leave you with this, where you can add a row of data.
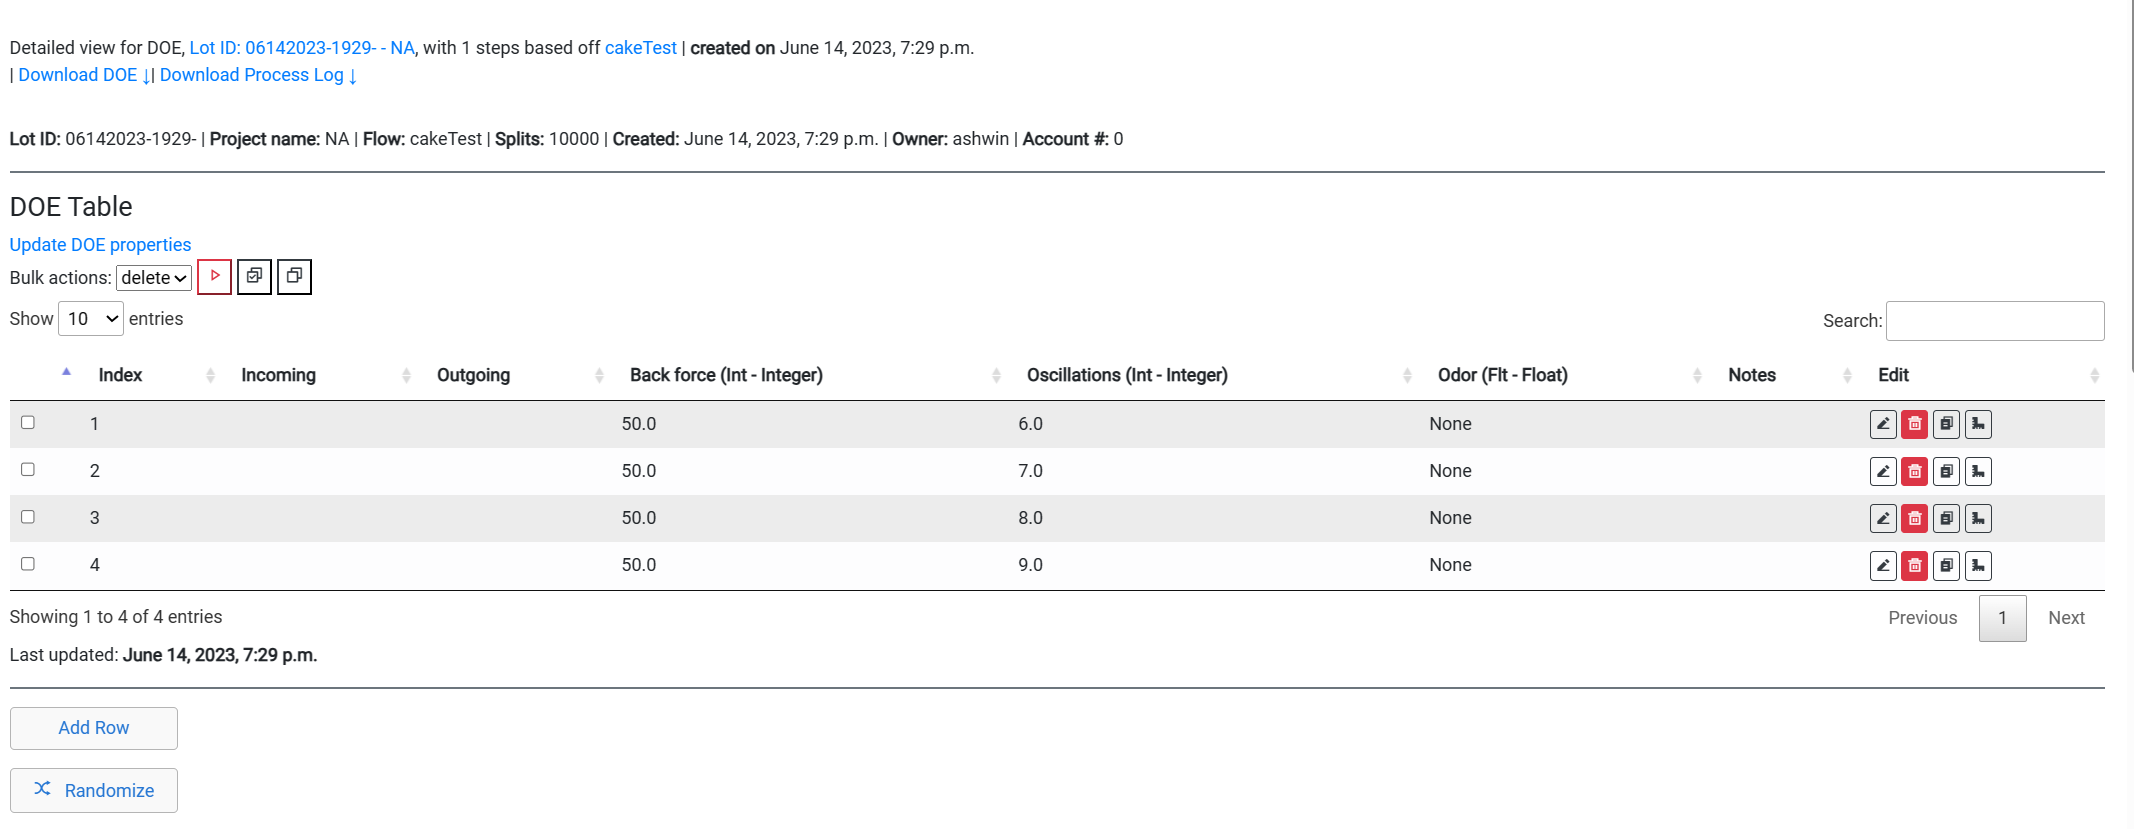
Figure 2.6
3.1. Adding the Data
This will take you to the next page. We see here the DOE we are working on. Then the Schema we have created previously. Notes are standard to understand each step of the way. The incoming and outcoming are there if the experiment is coming from someone and going to another. There is an optional alternative ID. For each of the parameters there will be a drop box with values to test. These were filled in previously.
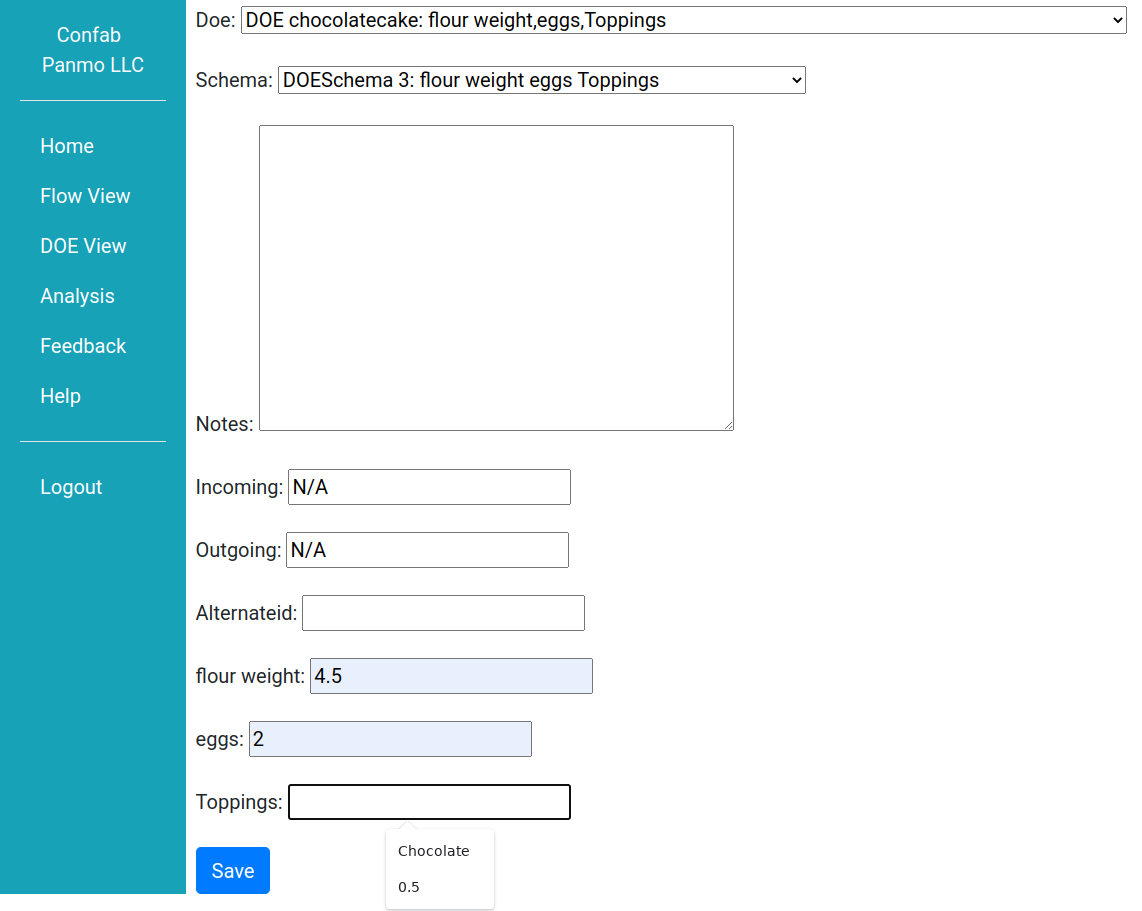
Figure 2.7
Once that is complete we will see something like this. You have now added one row of data.
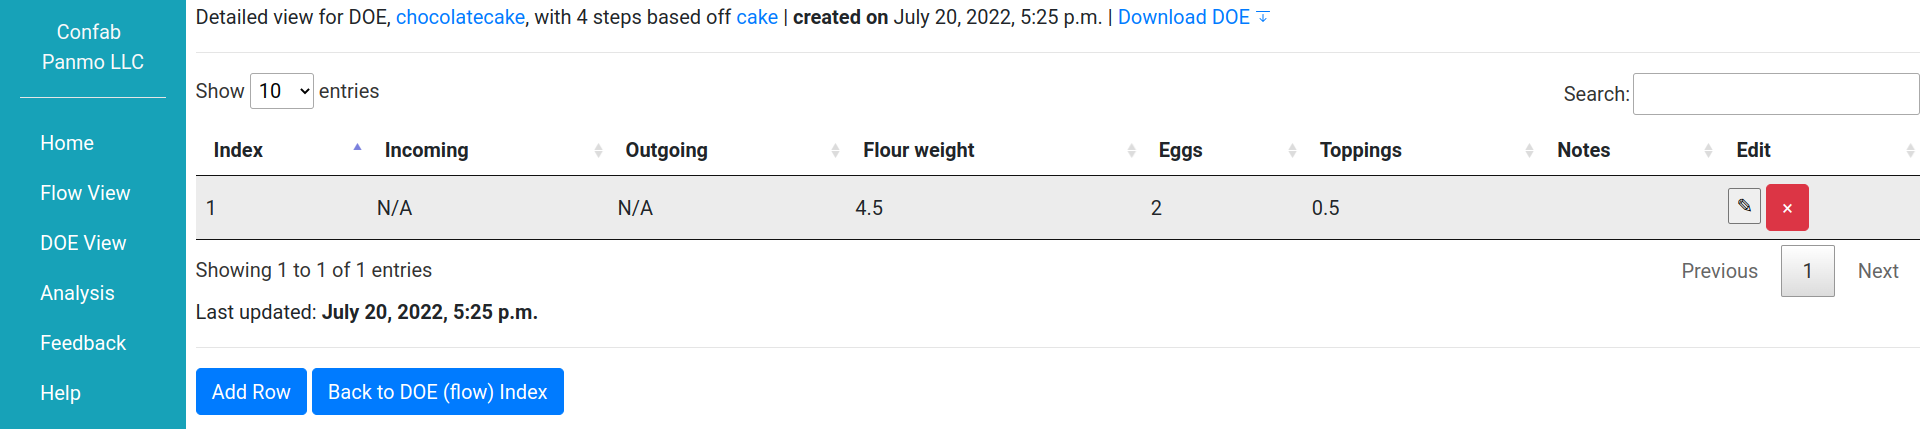
Figure 2.8
3.2. Design DOE
Then there is deigning your DOE. That will be at the end of your page next to create DOE. You will have a wide range of option. For this example we will be using full factorial. It will look like this.

Figure 2.9
You will be able to pick the parameters that you want to work with and their values. Commas are there to seperate the values. Be aware that DOE will increase exponentially. The more values, the bigger the DOE will be.
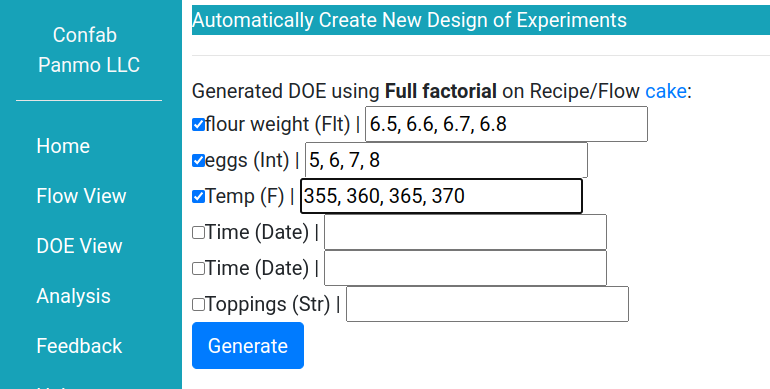
Figure 2.10
Then you can see a table like this. As you can see, this will create a DOE after you have designed it.
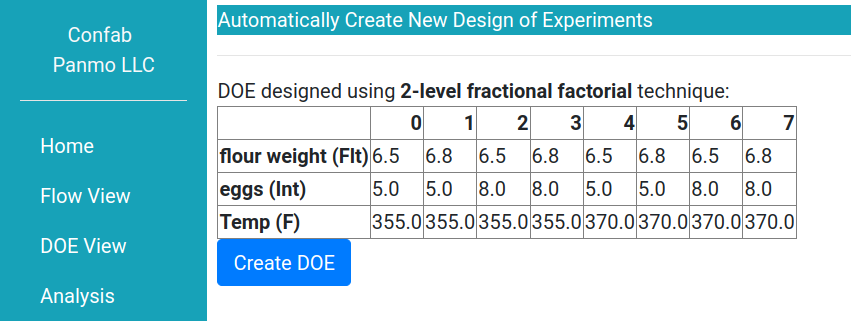
Figure 2.11
Once you click create DOE, the DOE will show up and look like this.
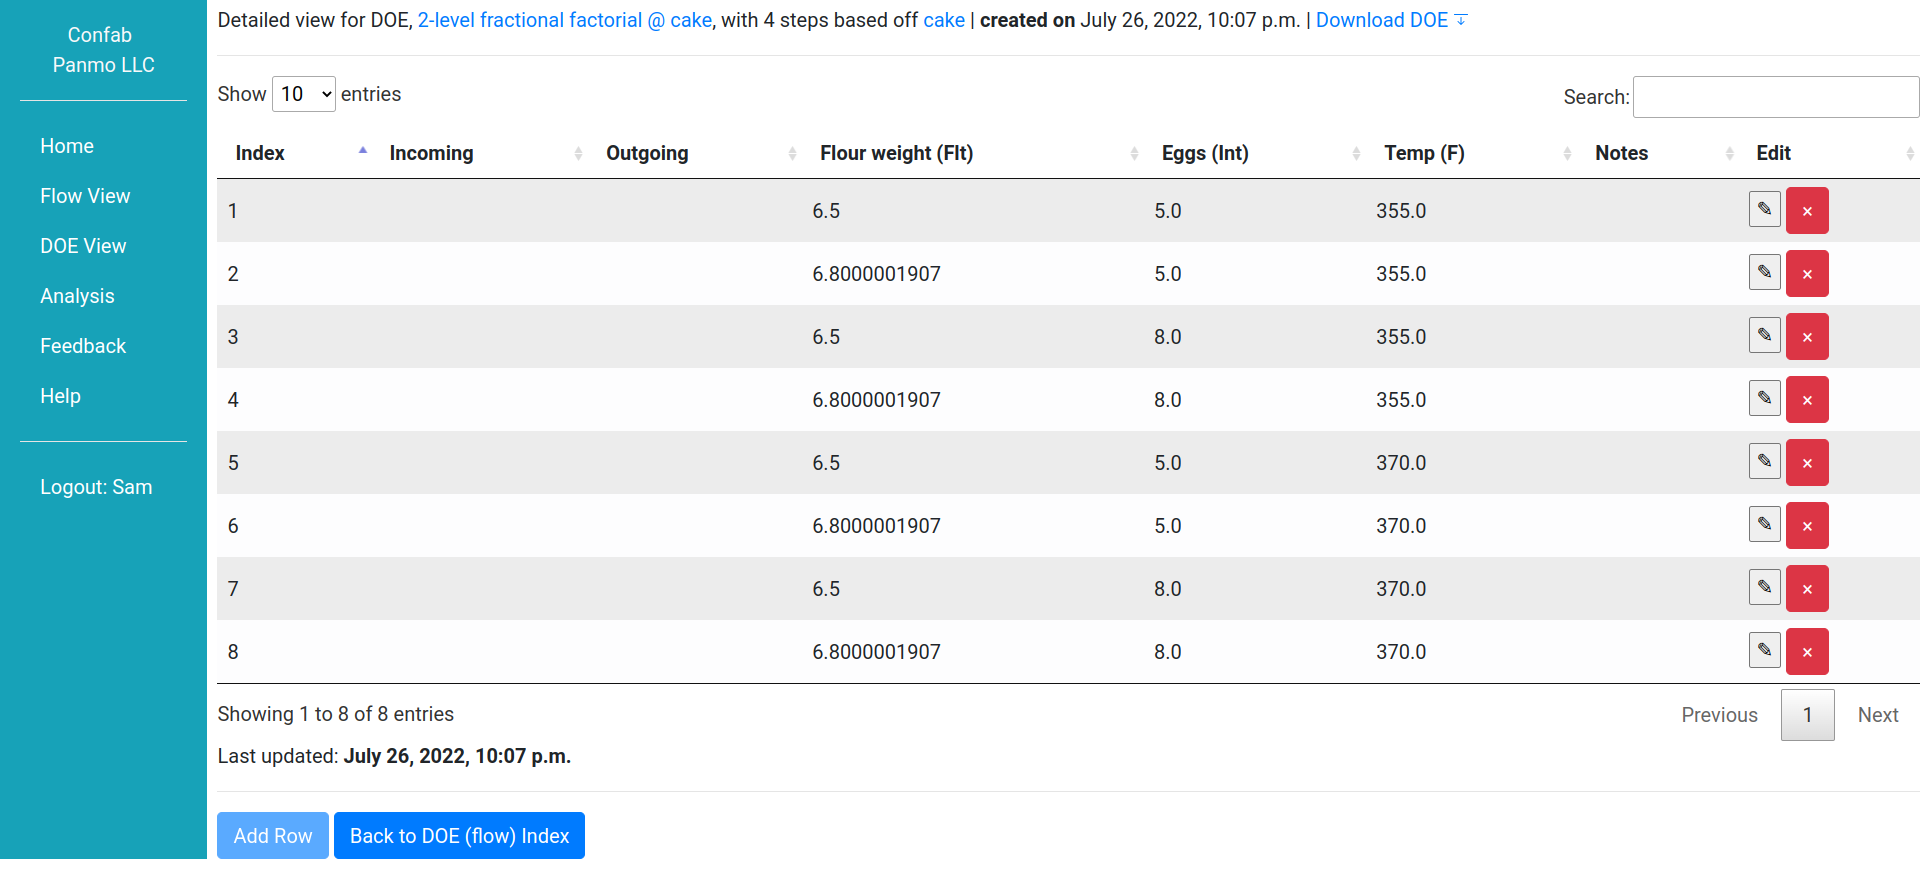
Figure 2.12